Great case study from Think with Google and Anheuser-Busch InBev on total #videoadvertising measurement, bridging Linear and Digital advrtiding- https://bit.ly/3ywj3XN
Love the three axioms laid out- #1 get out of channel/platform silos, #2 plan for total reach, #3 Balance long-term on short-term. For #2 beyond Google Reach Planner mentioned in the article, it is important to connect linear and Digital audiences using #ACR data mapped to device IDs/mobile Ad IDs (MAIDs). For #3, long-term impact can easily be added by leveraging YouTube's BrandLift tool (https://lnkd.in/ezAWF85A). In fact a cool add to this approach would be to test audiences built from TV in Digital to measure the combined lift of TV+Digital on awareness.

Do you need a vacation out of office email strategy?
Have you ever returned from vacation, where you were able to disconnect, recharge and rejuvenate, only to come back to a mountain of email that immediately elevated your stress to pre-vacation level? Summer is in full swing and most people are emerging from lockdown and planning some sort of time-off. And coming back from any meaningful amount of leave means you need to have a strategy to deal with email, especially since the advent of the pandemic brought a 50% increase in email volume. Here is is a great read on the topic. Some great advice in this quick read. Interesting observation by the author that the the vast majority messages she received during her vacation didn't warrant direct response from her. Should we exclude people that have OOO messages on that indicate more than 2-3 days, unless they are critical to the conversation? Or may be if critical write them a separate note with delivery delayed to the day of their return? I don't know, but in any case, this is an area where I suspect corporate culture will evolve soon, because it is evident it is a stress inducer! #email #strategy #corporateculture #worklifebalance #vacationmode
Too much stimulus in the economy?
The Conference Board forecasted a record US Real GDP growth of 9.0 percent (annualized rate) in Q2 2021 and 6.6 percent (year-over-year) in 2021. Compare that to 2019 real GDP growth of 2.3 percent in 2019 and 2.9 percent in 2018. In 2020, the U.S. economy shrank by the largest amount in 74 years, as unemployment rate peaked at a historic high of 14.8% in April 2020 (as of June ’21 unemployment is down to 5.9%).
University of Michigan Consumer sentiment has edged up to 85 from the pandemic low of 71.8 last April (still not quite back to the pre-pandemic high of 99.3 in Dec 2019).
This strength seems to be translating well to consumer spending. Personal Consumption Expenditures (PCE), after dropping 18% from Feb ’20 to April ’20, grew back ~28% (April ’20 to May ’21), erasing all of the declines to bring it back in line with its multiyear 3.5% annualized growth rate. The National Retail Federation revised its retail sales growth expectation to 10.5 - 13.5 percent (vs. 2020), to a range between $4.44 trillion and $4.56 trillion (up from 6.5 percent - 8.2 % expectation just 6 months back). US demand for goods and services is driving global economic recovery for the first time since 2005 (https://lnkd.in/e2KgbAX).
Of course, the sheer breadth and magnitude of the stimulus aid has directly impacted the strength of the GDP rebound in 2021. According to the Committee for a Responsible Federal Budget (https://lnkd.in/erkXHc6), of the $5.9 trillion ($5.2 trillion net) of enacted COVID relief, $3.6 trillion was committed or disbursed over the one-year period beginning last April, resulting in a nominal disposable personal income (DPI) growth of 10.6 percent, or 2X the income growth of 5% per year over the prior three years. According to CRFB, absent COVID relief and its economic effects, personal income would have fallen by about 5 percent. For now, we can be content with a turbocharged US economy (and contend with the inflation risk!). #economy #growth #retailsector #markets #inflation #consumerspending #consumersentiment
Google's not extending FLoC origin trials as part of its Privacy Sandbox Cookieless future
As the #adtech universe digests Google's decision last month to give a reprieve to the third party cookie until 2023, here's some insight from #Chromium (https://lnkd.in/etrhDwm) into #FLoC Origin trials (part of Chrome #PrivacySandbox) that are ending tomorrow:
-33,872 browsing interest based Cohorts (FLoCIDs)
-2000 minimum number of qualifying Chrome users in a cohort
-33,872 browsing interest based Cohorts (FLoCIDs)
-2000 minimum number of qualifying Chrome users in a cohort
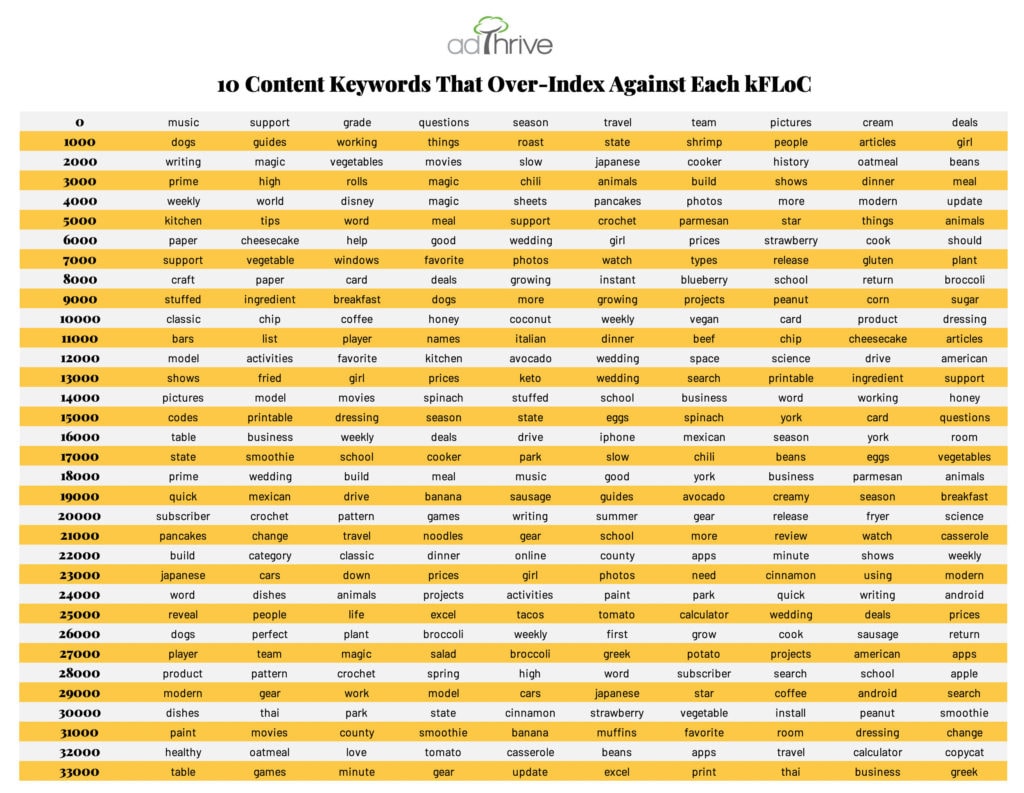
-735 minimum number sets of visited domains in a cohort. Content creator CafeMedia's AdThrive did an interesting analysis below on grouping the 34K FloCIDs into 34 sets of 1000 each (they call it KFLoCs) and mapped their top 10 content keywords. On the downside, this analysis shows fuzzy targetable interest patterns at best (foodie, outdoors, travel from a quick glance). Probably part of the reason Google apparently is not extending the trial, but instead are "hard at work on improving FLoC to incorporate the feedback we’ve heard from the community before advancing to further ecosystem testing". IMO, this doesn't mean advertisers should lift their foot off the #cookieless pedal, it is inevitable, given other major browsers have already done this. Personally, I think, if anything, the FLoC experiment highlights the need to hedge your bets with other approaches including building a #firstpartydata ecosystem and/or explore audience #identity consortiums. (https://lnkd.in/eQ3pGx7) #google #thirdpartycookies #audiencetargeting #addressability #cookieless
WFH email explosion- time to retire your inbox?
At an average minute per email (those that need a response needing more, others less), that meant 2 hours per day working through emails. With pandemic WFH, that has gone up by 50%. So you have to set aside up to 3 hours per day to deal with email. And you have to come up with strategies to block off this time especially If you have back to back meeting days. So I am all for simpler communications (and rules around email lengths- no more 3 page essays!). But project chat boards do need better organizing- love the ability to call out a specific person using @, but I should be able to filter by team member or topic.
New Product Marketing Playbook (in other words, they won’t come just because you built it)
Let’s face it- given the poor performance of most innovations, that new product you are working on doesn’t have the averages in its favor. Most innovations are going to be mediocre at best- an HBR article quotes “Less than 3% of new consumer packaged goods exceed first-year sales of $50 million”. That means marketers and product managers that place a bet on an innovation are more likely to be “explaining” its performance than have it be an accolade on their annual performance review.
And yet every successful marketer or company will unanimously agree that innovation is the lifeblood of growth. Innovation is vital to offering a better product or service, managing your business more efficiently and/or effectively and as a safeguard against competitive share losses. Unless of course you are the only game in town- if you are, then congrats, you may stop reading right now. If you are like the rest of us and not running a monopoly operation then hopefully some of this post will be of relevance.
There are really only 3 major ingredients to orchestrating a successful innovation agenda- a good product, one that is relevantly differentiated, a Marketing strategy that engages your target market with the right message at the right place and time and a consumer intelligence apparatus that allows you to course-correct rapidly. Note I said “successful innovation agenda” not “successful innovation”. Secret to innovation sanity is not betting all your money on a single idea but beating the average through a portfolio of innovations (unless you are a startup, then its OK to be all in on the one big bet).
Check the full article out on LinkedIn:
3 under-appreciated trends in consumer behavior (and resultant imperatives for marketers)
The US economy is heavily consumer dependent- that is
pretty much stating the obvious. What we seem to be oblivious to is how much
the consumer that drives the economy has changed since the Great Recession. We
do however feel the symptoms- the tried and tested remedies of the past
struggle to drive momentum. Profits stagnate- data from the Bureau of Economics indicate
corporate earnings have been in decline since 2012 after staging a recovery
following the recession.
Many marketers are opting to simply take price up
as demand stagnates without truly understanding the shift in consumer behavior
that is making past playbooks irrelevant. Below LinkedIn in post hones
in on 3 familiar yet often underestimated trends that are directly shaping the
interplay between consumer behavior and marketing strategy.
Mike Walsh on building businesses for the 21st century @ IRI CPG Summit, Orlando-FL...
As I am recovering from the 2 months of prep-work that culminated
in IRI’s premier annual event last week in Orlando, I was thinking of some of
the keynote speakers and this guy Mike Walsh popped up in my mind. Mike is a
self-described “globally renown (ed) futurist and keynote speaker on future trends, innovation and how to build companies for the 21st century. BTW Mike if
you read this, not sure if you noticed the typo on your home page meta id
descriptor, I know it is nit-picking but Google indexer has already picked it up with the typo J.
So in his very entertaining presentation, he had these
things he calls “mind grenades” (basically key takeaways) and two stood out-
1.
If your
kids had your job, what is one thing they would do differently? First I
thought, is he asking us to bring the Crayola set or the Wii to work (depending
upon how old your kids are)? Then as I thought more, it made perfect sense.
Mike's point was to recruit the next generation of thought leaders and see how
they would approach your tasks from their vantage view. Cool.
2.
What is
something that your customers do today that drives you crazy? (Hmm, where do
I start?) So the point here is that the points of friction between the service
you are trying to provide somebody and how they are trying to consume it is an
opportunity for innovation, and therefore, engagement. Freakin awesome! (and
simple, why didn't I think of this??).
My two cents- every business today and in the future
needs to create a “simplicity filter”- a device or process that takes every
product or service you design and score it- a plus for features that make it
simple and a minus for things that make it complex. If the pluses are not
twice as many (at least) as the minuses, pull it off the market. Life is getting increasingly complex and if your product adds to that complexity rather than taking away from it, you are doomed from the get go...
IRI CPG Blog Post: Surf’s up! Time to Ride the Online Video Wave?
Posted on the IRI CPG Blog a couple of weeks back about the traction Online Videos have been getting in the industry in direct competition to traditional TV advertising.
The post highlights 3 reasons to get in on Online Videos today:
The post highlights 3 reasons to get in on Online Videos today:
- Efficiently enhance your message reach on traditional TV
- Test your TV campaigns
- Reap early adopter benefits
Employee Strategy: (in?) Flexible Work Program @ Yahoo!
This past week Yahoo! HR head purportedly issued a memo revoking work-from-home arrangements for employees. If the "internal" memo at the above link is to be believed, the HR Head, among other reasons cited "Speed and quality are often sacrificed when we work from home" as being one of the reasons for the change. Holy smoke! If this is true, then essentially this is an admission on HR's part that in this day and age when telecommuting is a way of life, they have failed at instilling a corresponding performance management culture that can leverage this awesome advancement in work culture to happen in a 100 years. With the right performance tracking processes and communciations protocols, telecommuting can increase productivity several fold. I say this because I am surrounded by people who do this every day (including myself) and everybody is working well over the mandated 8-hour workday, actually getting stuff done. So if this is all true (I still don't believe it), then Yahoo! just admitted they failed at getting telecommuting right. Corporate culture is a two-way street, the company has as much a responsibility of creating an atmosphere of accountability as well as trust as employees have of being diligent. Every CEO probably has at least one decision they are going to regret for the rest of their career and, if this is really her decision, Marissa Mayer may just have made the one that will top her "I wish I had thought this through a bit more" list!
SetFocus: Revisiting your 2013 Marketing Playbook
The
U.S. Economy in 2013…
General
consensus among economists is that of weak to moderate growth in early 2013, and
a stronger recovery coming in the later half from the Housing sector, but there
are other headwinds at play that could have a dampening effect early in the
year, including the debt ceiling debate (once again), expiring tax cuts and
spending reductions (collectively known as the “fiscal cliff”). On Jan 23, the “No
Budget, No Pay Act” temporarily suspending the Debt Ceiling until later in the
year, but without congressional action this issue will resurge before year end
if there is no budget adopted by Senate by then. The recurrence rate of this
issue is taking a toll on consumer confidence and capital investment/job
creation, as indicated by low readings of the Michigan Consumer Sentiment- this
indicator, has been exceeding consensus expectations for the last couple of
months – today’s reading at 76.3 is above expectation of 75, but still well
below the low 80 readings going into 2012 year end.On the positive side, there’s some indication including forecasts from The World Bank Commodity Price Forecast, of lower commodity prices in 2013, which can provide some tailwinds[1]. The DOE also predicts lower gas prices in 2013[2], which generally helps consumption by freeing up disposable income and driving shopping trips up.
The Employment report in February (for January) came in a bit below expectations at +157K, which is lower than the previous revised number of +196K- 2012 average growth was 181K/month.
What does this mean for your 2013 Marketing Strategy?
If economic uncertainty continues building up into mid-2013, then marketing strategy early in the year should emphasize your value proposition, focusing on share growth through Trade and Consumer promotion investment. Any relief in costs from favorable commodity pricing changes should be passed through 100% to consumers. Advertising focus, both online and off-line, should be on lower funnel that aims to increase conversions by “nudging” consumers sitting on the fence on your brands and retaining existing consumers that may be vulnerable to competitive promotional incursions. Paid Search is especially a good way to get in front of consumers one step before the purchase decision. Paid Search importance is going to be even greater in driving conversion with Product Listing Ads (Google Shopping’s new rich ads functionality[3]).
As
the economic uncertainty abates towards mid-2013, focus should shift to
longer-term brand building and differentiating your brands to reduce dependence
on promotions through strong upper funnel advertising activity. Later in the
year is also a good time for new product launches as consumers tend to be more
open to trial under lesser economic uncertainty. This shift to shoring up brand
equity should help position your portfolio for a strong finish to 2013and
create a strong momentum into 2014.
Hurricane Sandy and Income Inequality debates..
Came across this article on Reuters from Pulitzer-prize winning columnist David Rohde "A Hurricane's inequality". The article points out how even a natural disaster like Hurricane Sandy affected the rich and the poor differently and how the event highlighted income disparities in New York. The author used examples like the rich evacuating to hotels while service folks continued servicing. He then goes on to point out that "Last year the wealthiest 20 percent of Manhattan residents made $391,022 a year on average, according to census data. The poorest 20 percent made $9,681".
While I appreciate the point he is making, I am not sure the analysis is entirely fair. First of all the fact that everyone, irrespective of being rich and poor should have been able to retreat to safety. I view the fact that service folks continued servicing as a failure of the City authorities to enforce safety measures- businesses had no business (no pun intended) keeping employees back beyond a certain point.
That said, the income disparity between the top vs. the bottom quintile shouldn't be surprising based on economic behavior. The top 20%'s earnings being high is an artefact of NYC's ability to attract highly skilled labor that commands a wage premium, which in turn creates an abnormal demand for a secondary market of relatively lower skilled labor (nannies, waiters etc). Urbanization is known to create income inequalities for this reason- cities tend to attract from cheaper labor markets (immigrant, students etc). This is partially related to the Kuznets curve effect:
 Except that the inequality continues to rise exponentially due to a free inflow of unskilled labor that is willing to compete on price with existing unskilled labor. Comparing top-bottom quintile income disparity in a city that is only ~400 Sq miles yet boasts 1.2 Trillion dollars in GDP is pointless- there is an extreme division of labor and a continuous supply of labor (skilled and unskilled) that is more than willing to compete on price. Profits/income are inversely correlated to competitive intensity, labor markets are regulated in order to contain this profit-maximizing behavior within rational limits. Now what is worrysome is that based on New York State's minimum wage and a 40-Hour work-week, the lowest wages should be ~$15,000 p.a, the fact that it averages $9,681 in the bottom quintile could indicate a significant number of the labor market working below minimum wages, which probably reflects a failure in enforcing minimum wage discipline.
While I appreciate the point he is making, I am not sure the analysis is entirely fair. First of all the fact that everyone, irrespective of being rich and poor should have been able to retreat to safety. I view the fact that service folks continued servicing as a failure of the City authorities to enforce safety measures- businesses had no business (no pun intended) keeping employees back beyond a certain point.
That said, the income disparity between the top vs. the bottom quintile shouldn't be surprising based on economic behavior. The top 20%'s earnings being high is an artefact of NYC's ability to attract highly skilled labor that commands a wage premium, which in turn creates an abnormal demand for a secondary market of relatively lower skilled labor (nannies, waiters etc). Urbanization is known to create income inequalities for this reason- cities tend to attract from cheaper labor markets (immigrant, students etc). This is partially related to the Kuznets curve effect:

Is your Vision damaging your business?
…it is if your business planning cycle is typically 3 years or lesser. The longest planning horizon for most businesses entails new product development or acquisitions at around the 3-year horizon mark and marketing activities like advertising communications and pricing/promotions are typically planned annually.
 Brands aren’t built overnight and sustainable brands need an evolving strategy that will navigate economic cycles that are a lot longer than 2 or 3 years, in fact typical economic cycles are 7+ years.
 What you are missing out on is an opportunity to understand how your customers are adjusting their consumption behavior as the economy waxes and wanes. Granularity of information flooding researchers in recent years has motivated business strategy to be focused on maximizing short term profits and opportunities. Don’t get me wrong, short-term planning is important- the short-term is the bridge to the long-term and public companies are answerable to shareholders in the short-term. At the same time the most sustainable brands and businesses are the ones that have the information and experience to help them adjust to economic changes. In that respect, Businesses need to be like Neural Networks- learn and adapt based on past experiences, while adjusting to newer paradigm shifts. While lifestyles evolve and change much more rapidly today than they did 10 years back, there are some consistencies that business managers need to take into account especially if they are in the B2C domain.
For example how people adjust to economic upheavals, what spending categories do they curtail during a downturn and which ones do they prioritize coming out of a downturn. If you compare the growth in Retail spend data by segments from the U.S. Census Bureau from 2004 to the spending from 2011 (2 years post the respective recessions), you will notice some remarkable consistencies. The top 3 segments by growth vs. prior year in both cases were Building Materials, General Merchandise and Restaurants, while Electronics, Apparel and Sporting/Music stores were bottom segments.
 How cool would it be if you could predict how your customers are going to change their consumption preferences in a sluggish economy and an expanding economy, what trade-offs in terms of share of wallet would they make as the size of their wallet shrinks or expands? And how cool it would be if you were able to anticipate these changes in consumption preferences and adjust your product portfolio, assortment and marketing/pricing strategies accordingly? So one would think it is easy for businesses to compare what their customers did in the Great Recession vs. the 2001 Recession, but you would be surprised even with big data how few companies have less than 5 years of data readily accessible for analysis. However different we are today compared to 10 years back, some elements of history do tend to repeat and if you chose not to learn from history you may well be condemned to repeat it.


For example how people adjust to economic upheavals, what spending categories do they curtail during a downturn and which ones do they prioritize coming out of a downturn. If you compare the growth in Retail spend data by segments from the U.S. Census Bureau from 2004 to the spending from 2011 (2 years post the respective recessions), you will notice some remarkable consistencies. The top 3 segments by growth vs. prior year in both cases were Building Materials, General Merchandise and Restaurants, while Electronics, Apparel and Sporting/Music stores were bottom segments.

Redefining Risk-Free...
For the longest period of time the classic proxy for the theoretical risk-free rate has been the 3-Month U.S. Treasury Bill, this may have to be re-thought given the U.S. debt-crisis that just got "resolved" today. The crisis brought home the realization that the U.S. Ecoomy, far from being infallible, is actually vulnerable in it's present state.
The longer-term ramifications of both the crisis itself and the solution that was agreed upon today are going to be profound. The United States has re-discover its place in the global economy instead of relying on past laurels, and soon, while the other developed nations still look to it for economic leadership and haven't realized that this need is more psychological than anything else...
The longer-term ramifications of both the crisis itself and the solution that was agreed upon today are going to be profound. The United States has re-discover its place in the global economy instead of relying on past laurels, and soon, while the other developed nations still look to it for economic leadership and haven't realized that this need is more psychological than anything else...
Employment Outlook: ADP vs BLS...
Earlier this week the Markets were buoyed up by some favorable economic reports coming out, but most significantly by yesterday's ADP Employment report that predicted a 157K increase in private jobs. Traders that were holding short positions given the low seasonal performance of markets in summer months, further drove markets up in a "short squeeze rally".
Come Friday morning, the BLS Employment report came out, and proved ADP wrong...yet again. According top BLS estimates, only 18K Non-Farm jobs were added in June, much lesser than the 105K economists were expecting and a miniscule fraction of the 157K ADP predicted. And this is a consistent pattern in the past year, ADP has been off vs BLS by 50% or more on at least 6 occasions. That is a coin toss. So I say either ADP proves why they have a better read on employment than BLS or they stop reporting this number in the public interest...as it is the markets are jittery and beyond the implications to investors, the markets have a direct bearing on consumer and corporate morale. We do not need another volatile factor added to an already chaotic mix of indicators.
Come Friday morning, the BLS Employment report came out, and proved ADP wrong...yet again. According top BLS estimates, only 18K Non-Farm jobs were added in June, much lesser than the 105K economists were expecting and a miniscule fraction of the 157K ADP predicted. And this is a consistent pattern in the past year, ADP has been off vs BLS by 50% or more on at least 6 occasions. That is a coin toss. So I say either ADP proves why they have a better read on employment than BLS or they stop reporting this number in the public interest...as it is the markets are jittery and beyond the implications to investors, the markets have a direct bearing on consumer and corporate morale. We do not need another volatile factor added to an already chaotic mix of indicators.
"Mix Modeling on its death-bed" Starcom MediaVest Group CEO Laura Desmond
http://www.adweek.com/internet-week-blog/laura-desmond-wants-her-industry-deep-six-its-market-mix-132255
Starcom MediaVest Group CEO (and #57 on Forbes 100 most powerful Women in 2008) Laura Desmond believes that Marketing Mix Modeling, platform for measuring Advertising ROI is on it's death-bed, citing backward-looking focus and lack of ability to evaluate consumer attitudes as part of the reason it is becoming obsolete.
I think Marketing ROI as a concept won't go away (taking care to distinguish Mix Modeling as the device and Marketing ROI as the objective) for at last a couple of reasons:
-Elegance in evaluating Marketing Strategy was not the primary raison d'etre for the approach, it came about as a means for stakeholders outside the Marketing Department to understand how the dollars they were pumping into advertising was contributing to topline growth (and bottomline performance)- in other words the "business performance" focus she faulted. After all influencing consumer attitudes is not the end-goal of advertising, growing sales is (by influencing consumers positively), so successful advertising needs to demonstrate ability to drive both, not just any one of the two purposes.
-Today the approach does more than that and can simultaneously evaluate both business performance and consumer attitudes, depending upon how much effort you want to put in. I have already written in the past that consumer attitudes not only can but should be measured in marketing-mix models (http://papers.ssrn.com/sol3/papers.cfm?abstract_id=1411790)
Starcom MediaVest Group CEO (and #57 on Forbes 100 most powerful Women in 2008) Laura Desmond believes that Marketing Mix Modeling, platform for measuring Advertising ROI is on it's death-bed, citing backward-looking focus and lack of ability to evaluate consumer attitudes as part of the reason it is becoming obsolete.
I think Marketing ROI as a concept won't go away (taking care to distinguish Mix Modeling as the device and Marketing ROI as the objective) for at last a couple of reasons:
-Elegance in evaluating Marketing Strategy was not the primary raison d'etre for the approach, it came about as a means for stakeholders outside the Marketing Department to understand how the dollars they were pumping into advertising was contributing to topline growth (and bottomline performance)- in other words the "business performance" focus she faulted. After all influencing consumer attitudes is not the end-goal of advertising, growing sales is (by influencing consumers positively), so successful advertising needs to demonstrate ability to drive both, not just any one of the two purposes.
-Today the approach does more than that and can simultaneously evaluate both business performance and consumer attitudes, depending upon how much effort you want to put in. I have already written in the past that consumer attitudes not only can but should be measured in marketing-mix models (http://papers.ssrn.com/sol3/papers.cfm?abstract_id=1411790)
Playboy Outsourcing Operations? Times must really be tough!!
Playboy Enterprises Inc. recentlly announced that they will be outsourcing most of their operations to American Media Inc. in a 5-year partnership deal.
Apparently it's not party time anymore at the company Hugh Hefner started (partly with money loaned by his mother). In fact they have seen their margins erode progressively over time. They netted out $2.3MM profits on revenues of $331MM in 2006 (0.7% margin), in 2007 they made $4.9MM in profits on $340MM in revenues (1.4% margin). To put their operating profitability in perspective, consider this- Playboy operating profits in '07 were $10MM, giving an operating margin of 2.9%. Bauer Consumer Media, publishers of FHM magazine had operating profits of £65.4MM during the 12 months to 31 March 2008 on revenues of £313.1MM- a 20.9% margin. So they do need a revamping of their operational strategy. Especially given the manual intensive nature of the publishing business, the economies of scale AMI can bring to the table may reeally unlock the profit potential at this controversial yet iconic brand. I guess they are hoping that AMI, which has a score of successful magazine titles in their portfolio can help them improve operational effectiveness.
Apparently it's not party time anymore at the company Hugh Hefner started (partly with money loaned by his mother). In fact they have seen their margins erode progressively over time. They netted out $2.3MM profits on revenues of $331MM in 2006 (0.7% margin), in 2007 they made $4.9MM in profits on $340MM in revenues (1.4% margin). To put their operating profitability in perspective, consider this- Playboy operating profits in '07 were $10MM, giving an operating margin of 2.9%. Bauer Consumer Media, publishers of FHM magazine had operating profits of £65.4MM during the 12 months to 31 March 2008 on revenues of £313.1MM- a 20.9% margin. So they do need a revamping of their operational strategy. Especially given the manual intensive nature of the publishing business, the economies of scale AMI can bring to the table may reeally unlock the profit potential at this controversial yet iconic brand. I guess they are hoping that AMI, which has a score of successful magazine titles in their portfolio can help them improve operational effectiveness.
2009 Retail Season Half-time: Black Friday '09
Black Friday '09 has come and gone and the experts are already making prognostications about the rest of the '09 Holiday Season and the health of the Retail Sector. Talk about opinions being divided- on Yahoo! Finance itself there were two articles posted a day apart taking opposing views- "Early indicators of Black Friday sales promising" and "Black Friday: D-Day for 'Deals' and a 'Dismal' Economy". I think both perspectives hold some water. The average American consumer has seen some benefit from economic pressures easing off over the last few months and have had some of their purchasing power replenished. They do not have enough to splurge across the board this Holiday season, so we will probably see them making a lot of trade-offs- a family vacation or new clothes for the family or that big flat screen TV we've been thinking off. Seeing the mad rush at Wal-Mart and at BestBuy, I think Retailing analyst Kristin Bentz (The Talented Blonde blog) is right, the two themes top of mind for the American consumer this Holiday season will be Value and Technology- retailers across all sectors that will get the perfect balance of value vs. profitability will come on top, and technology retail in general seems to be poised to do better than the rest- if the average consumer is going to splurge he or she wants to do it on something longer lasting like a computer or a new TV.
Review of "The Shift Index 2009: Industry Metrics and Perspectives” (Deloitte.com Article)
I came across this report from Deloitte “The Shift Index 2009: Industry Metrics and Perspectives” (published November 4, 2009) that takes a deep dive look at Corporate performance across a broad group of industries including Aerospace& Defense, Financial Services Consumer Products and Retail, Technology, Media, Telecommunications, and Automotive. In spite of the vague and cryptic nature of the content, I think there is some real value in going through this (that is if you have the patience to digest a 208-page manuscript- someone should talk to the authors about the need to be succinct when producing content for web-publishing).
The key theme of this rather lengthy report is that Return on Assets across public companies is down 75 percent and corporate performance metrics currently utilized across businesses may not be appropriate.
The report then proposes that there is a “Big Shift” in underlying economic and behavioral trends the convergence of which is the fundamental driver of this performance erosion. The report then goes on to dissect how this so-called Big Shift is playing out across these different industries.
The report further proposes a “Shift Index” to quantify this phenomenon along three dimensions (quantified by 3 other indices- I suppose they need to make it complicated to sound sophisticated!):
Foundation Index: As defined by the report “The Foundation Index reflects new possibilities and challenges for business as a result of new technology capability and public policy shifts.” Put simply this is the infrastructure that has redefined business processes including digital infrastructure, and asynchronous and integration of geographically disparate resources that optimizes productivity. This metric is apparently evaluated at economy-level and therefore not analyzed by industry. Not sure why this would not differ across industries in an economy?
Flow Index: Defined by the report as “the Flow Index, is characterized by the increasing flows of capital, talent, and knowledge across geographic and institutional boundaries.” Translation- this basically builds on the Foundation Index- which is a more static perspective of resources. The Flow Index emphasizes the fact that Knowledge, Technology and other resources are in a constant state of flux and emphasizes the ability to constantly tap into evolving reservoirs of these resources to replenish current resources (not surprisingly- in the spirit of complicating concepts in pursuit of sophistication the report looks at two additional metrics within the Flow Index- Inter-firm Knowledge Flows and Worker Passion metrics).
Impact Index: If the descriptions on the previous two metrics were a bit vague, this one borders the esoteric. “…the Impact Index reflects how well companies are exploiting foundational improvements in the digital infrastructure by creating and sharing knowledge— and what impacts those changes are having on markets, firms, and individuals.” From my humble view-point, I think this is basically a measure of how well companies leverage their abilities around the previous two indices to create competitive advantage- I can buy that.
All in all I think there is some very useful information in this report, as to the effort required to go through this article to get to that information- to tweak a quote from a well-known movie "the juice may be just about worth the squeeze". If you are looking for specific analysis for the industry vertical of your interest, I would recommend going through the corresponding section of the report- what I have summed up above should save you some time on the rest of the material.
Note: This is an independent and unsolicited review of publicly-available material and neither the writer of this commentary nor this website takes any credit or liability for the original material being reviewed in this commentary. Please use your judgment in considering this review.
The key theme of this rather lengthy report is that Return on Assets across public companies is down 75 percent and corporate performance metrics currently utilized across businesses may not be appropriate.
The report then proposes that there is a “Big Shift” in underlying economic and behavioral trends the convergence of which is the fundamental driver of this performance erosion. The report then goes on to dissect how this so-called Big Shift is playing out across these different industries.
The report further proposes a “Shift Index” to quantify this phenomenon along three dimensions (quantified by 3 other indices- I suppose they need to make it complicated to sound sophisticated!):
Foundation Index: As defined by the report “The Foundation Index reflects new possibilities and challenges for business as a result of new technology capability and public policy shifts.” Put simply this is the infrastructure that has redefined business processes including digital infrastructure, and asynchronous and integration of geographically disparate resources that optimizes productivity. This metric is apparently evaluated at economy-level and therefore not analyzed by industry. Not sure why this would not differ across industries in an economy?
Flow Index: Defined by the report as “the Flow Index, is characterized by the increasing flows of capital, talent, and knowledge across geographic and institutional boundaries.” Translation- this basically builds on the Foundation Index- which is a more static perspective of resources. The Flow Index emphasizes the fact that Knowledge, Technology and other resources are in a constant state of flux and emphasizes the ability to constantly tap into evolving reservoirs of these resources to replenish current resources (not surprisingly- in the spirit of complicating concepts in pursuit of sophistication the report looks at two additional metrics within the Flow Index- Inter-firm Knowledge Flows and Worker Passion metrics).
Impact Index: If the descriptions on the previous two metrics were a bit vague, this one borders the esoteric. “…the Impact Index reflects how well companies are exploiting foundational improvements in the digital infrastructure by creating and sharing knowledge— and what impacts those changes are having on markets, firms, and individuals.” From my humble view-point, I think this is basically a measure of how well companies leverage their abilities around the previous two indices to create competitive advantage- I can buy that.
All in all I think there is some very useful information in this report, as to the effort required to go through this article to get to that information- to tweak a quote from a well-known movie "the juice may be just about worth the squeeze". If you are looking for specific analysis for the industry vertical of your interest, I would recommend going through the corresponding section of the report- what I have summed up above should save you some time on the rest of the material.
Note: This is an independent and unsolicited review of publicly-available material and neither the writer of this commentary nor this website takes any credit or liability for the original material being reviewed in this commentary. Please use your judgment in considering this review.
Marketing Effectiveness Analytics Comes of Age
As Marketing Effectiveness Analytics comes of age, it seems to have been promoted from specialized firms to it's own practice area within Marketing Strategy dvisions of Crème de la Crème of the consulting world and from an esoteric existence within Market Research Departments to the Corporate Boardroom- almost a Cinderella story. Marketing Effectiveness Analytics today is the tool of choice while setting benchmarks and hurdle rates for assessing marketing campaign performance, setting new product marketing budgets and pricing strategy shifts.
Studies like Marketing ROI Analysis (a.k.a Marketing-Mix Modeling a.k.a Marketing Effectiveness Analysis), Marketing Spend and Advertising Optimization etc. were not mainstream services within the Marketing practice area of blue-chip firms like McKinsey, Accenture, Booz and Deloitte. Now these firms have dedicated sections to Marketing Effectiveness/Efficiency within their Marketing practice area. It's not as if they have created new and improved version of these analytics that have been practiced by niche firms for the last 20 years or so, they have just added their branding to them and this is causing C-level execs to take notice. So now that Marketing Effectiveness Analytics has established as a mainstay within the "must-haves" of Market Research tools, hopefully there will be more focus on standardizing this tool across industries so that the results can be normalized and used as benchmarks.
One potential outcome of marketing effectiveness becoming a standardized corporate practice is that GAAP could be amended to treat Marketing as a Capital expense (maybe a bit of a stretch but not impossible). This will have far-reaching effects on marketing budget management- for instance if marketing expenses could be capitalized and amortized over time instead of in the same revenue period, Corporate stakeholders would be less likely to slash marketing budgets every time costs need to be trimmed. Return hurdles set by Marketing Effectiveness analyses would ensure that marketing spending is efficient and productive thereby providing a check to a tendency to overspend and amortize over longer periods. Just a thought.
Studies like Marketing ROI Analysis (a.k.a Marketing-Mix Modeling a.k.a Marketing Effectiveness Analysis), Marketing Spend and Advertising Optimization etc. were not mainstream services within the Marketing practice area of blue-chip firms like McKinsey, Accenture, Booz and Deloitte. Now these firms have dedicated sections to Marketing Effectiveness/Efficiency within their Marketing practice area. It's not as if they have created new and improved version of these analytics that have been practiced by niche firms for the last 20 years or so, they have just added their branding to them and this is causing C-level execs to take notice. So now that Marketing Effectiveness Analytics has established as a mainstay within the "must-haves" of Market Research tools, hopefully there will be more focus on standardizing this tool across industries so that the results can be normalized and used as benchmarks.
One potential outcome of marketing effectiveness becoming a standardized corporate practice is that GAAP could be amended to treat Marketing as a Capital expense (maybe a bit of a stretch but not impossible). This will have far-reaching effects on marketing budget management- for instance if marketing expenses could be capitalized and amortized over time instead of in the same revenue period, Corporate stakeholders would be less likely to slash marketing budgets every time costs need to be trimmed. Return hurdles set by Marketing Effectiveness analyses would ensure that marketing spending is efficient and productive thereby providing a check to a tendency to overspend and amortize over longer periods. Just a thought.
Subscribe to:
Posts (Atom)