Great case study from Think with Google and Anheuser-Busch InBev on total #videoadvertising measurement, bridging Linear and Digital advrtiding- https://bit.ly/3ywj3XN
Love the three axioms laid out- #1 get out of channel/platform silos, #2 plan for total reach, #3 Balance long-term on short-term. For #2 beyond Google Reach Planner mentioned in the article, it is important to connect linear and Digital audiences using #ACR data mapped to device IDs/mobile Ad IDs (MAIDs). For #3, long-term impact can easily be added by leveraging YouTube's BrandLift tool (https://lnkd.in/ezAWF85A). In fact a cool add to this approach would be to test audiences built from TV in Digital to measure the combined lift of TV+Digital on awareness.Do you need a vacation out of office email strategy?
Have you ever returned from vacation, where you were able to disconnect, recharge and rejuvenate, only to come back to a mountain of email that immediately elevated your stress to pre-vacation level? Summer is in full swing and most people are emerging from lockdown and planning some sort of time-off. And coming back from any meaningful amount of leave means you need to have a strategy to deal with email, especially since the advent of the pandemic brought a 50% increase in email volume. Here is is a great read on the topic. Some great advice in this quick read. Interesting observation by the author that the the vast majority messages she received during her vacation didn't warrant direct response from her. Should we exclude people that have OOO messages on that indicate more than 2-3 days, unless they are critical to the conversation? Or may be if critical write them a separate note with delivery delayed to the day of their return? I don't know, but in any case, this is an area where I suspect corporate culture will evolve soon, because it is evident it is a stress inducer! #email #strategy #corporateculture #worklifebalance #vacationmode
Too much stimulus in the economy?
The Conference Board forecasted a record US Real GDP growth of 9.0 percent (annualized rate) in Q2 2021 and 6.6 percent (year-over-year) in 2021. Compare that to 2019 real GDP growth of 2.3 percent in 2019 and 2.9 percent in 2018. In 2020, the U.S. economy shrank by the largest amount in 74 years, as unemployment rate peaked at a historic high of 14.8% in April 2020 (as of June ’21 unemployment is down to 5.9%).
University of Michigan Consumer sentiment has edged up to 85 from the pandemic low of 71.8 last April (still not quite back to the pre-pandemic high of 99.3 in Dec 2019).
This strength seems to be translating well to consumer spending. Personal Consumption Expenditures (PCE), after dropping 18% from Feb ’20 to April ’20, grew back ~28% (April ’20 to May ’21), erasing all of the declines to bring it back in line with its multiyear 3.5% annualized growth rate. The National Retail Federation revised its retail sales growth expectation to 10.5 - 13.5 percent (vs. 2020), to a range between $4.44 trillion and $4.56 trillion (up from 6.5 percent - 8.2 % expectation just 6 months back). US demand for goods and services is driving global economic recovery for the first time since 2005 (https://lnkd.in/e2KgbAX).
Of course, the sheer breadth and magnitude of the stimulus aid has directly impacted the strength of the GDP rebound in 2021. According to the Committee for a Responsible Federal Budget (https://lnkd.in/erkXHc6), of the $5.9 trillion ($5.2 trillion net) of enacted COVID relief, $3.6 trillion was committed or disbursed over the one-year period beginning last April, resulting in a nominal disposable personal income (DPI) growth of 10.6 percent, or 2X the income growth of 5% per year over the prior three years. According to CRFB, absent COVID relief and its economic effects, personal income would have fallen by about 5 percent. For now, we can be content with a turbocharged US economy (and contend with the inflation risk!). #economy #growth #retailsector #markets #inflation #consumerspending #consumersentiment
Google's not extending FLoC origin trials as part of its Privacy Sandbox Cookieless future
As the #adtech universe digests Google's decision last month to give a reprieve to the third party cookie until 2023, here's some insight from #Chromium (https://lnkd.in/etrhDwm) into #FLoC Origin trials (part of Chrome #PrivacySandbox) that are ending tomorrow:
-33,872 browsing interest based Cohorts (FLoCIDs)
-2000 minimum number of qualifying Chrome users in a cohort
-33,872 browsing interest based Cohorts (FLoCIDs)
-2000 minimum number of qualifying Chrome users in a cohort
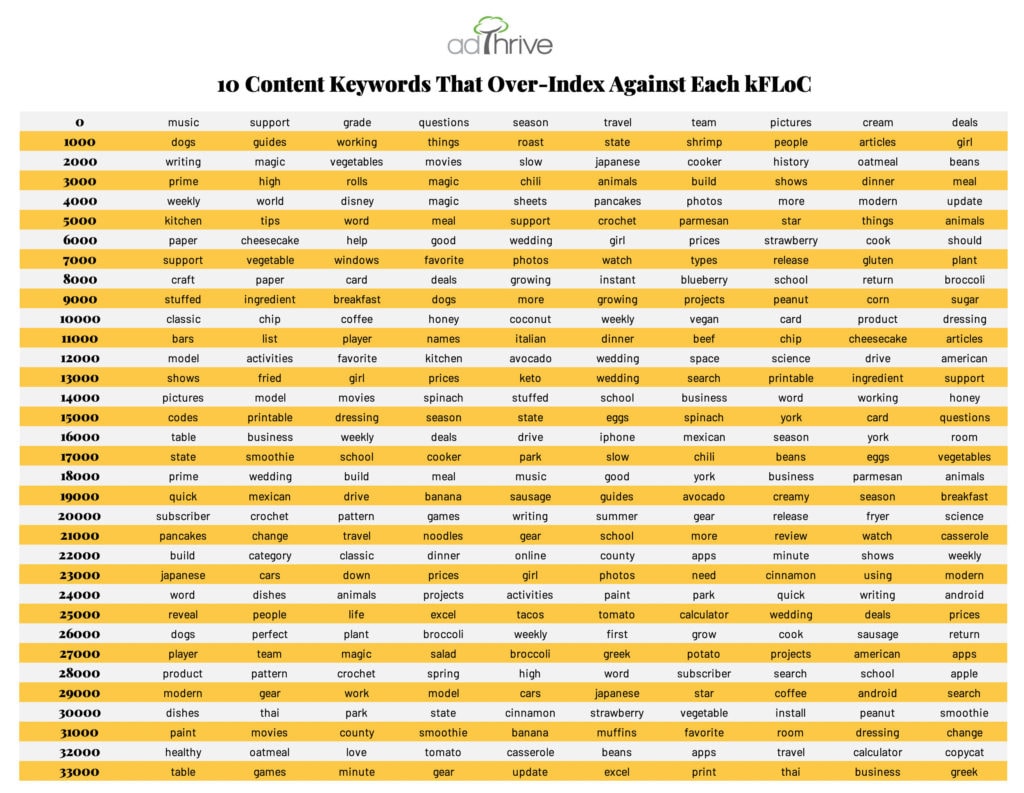
-735 minimum number sets of visited domains in a cohort. Content creator CafeMedia's AdThrive did an interesting analysis below on grouping the 34K FloCIDs into 34 sets of 1000 each (they call it KFLoCs) and mapped their top 10 content keywords. On the downside, this analysis shows fuzzy targetable interest patterns at best (foodie, outdoors, travel from a quick glance). Probably part of the reason Google apparently is not extending the trial, but instead are "hard at work on improving FLoC to incorporate the feedback we’ve heard from the community before advancing to further ecosystem testing". IMO, this doesn't mean advertisers should lift their foot off the #cookieless pedal, it is inevitable, given other major browsers have already done this. Personally, I think, if anything, the FLoC experiment highlights the need to hedge your bets with other approaches including building a #firstpartydata ecosystem and/or explore audience #identity consortiums. (https://lnkd.in/eQ3pGx7) #google #thirdpartycookies #audiencetargeting #addressability #cookieless
WFH email explosion- time to retire your inbox?
At an average minute per email (those that need a response needing more, others less), that meant 2 hours per day working through emails. With pandemic WFH, that has gone up by 50%. So you have to set aside up to 3 hours per day to deal with email. And you have to come up with strategies to block off this time especially If you have back to back meeting days. So I am all for simpler communications (and rules around email lengths- no more 3 page essays!). But project chat boards do need better organizing- love the ability to call out a specific person using @, but I should be able to filter by team member or topic.
New Product Marketing Playbook (in other words, they won’t come just because you built it)
Let’s face it- given the poor performance of most innovations, that new product you are working on doesn’t have the averages in its favor. Most innovations are going to be mediocre at best- an HBR article quotes “Less than 3% of new consumer packaged goods exceed first-year sales of $50 million”. That means marketers and product managers that place a bet on an innovation are more likely to be “explaining” its performance than have it be an accolade on their annual performance review.
And yet every successful marketer or company will unanimously agree that innovation is the lifeblood of growth. Innovation is vital to offering a better product or service, managing your business more efficiently and/or effectively and as a safeguard against competitive share losses. Unless of course you are the only game in town- if you are, then congrats, you may stop reading right now. If you are like the rest of us and not running a monopoly operation then hopefully some of this post will be of relevance.
There are really only 3 major ingredients to orchestrating a successful innovation agenda- a good product, one that is relevantly differentiated, a Marketing strategy that engages your target market with the right message at the right place and time and a consumer intelligence apparatus that allows you to course-correct rapidly. Note I said “successful innovation agenda” not “successful innovation”. Secret to innovation sanity is not betting all your money on a single idea but beating the average through a portfolio of innovations (unless you are a startup, then its OK to be all in on the one big bet).
Check the full article out on LinkedIn:
3 under-appreciated trends in consumer behavior (and resultant imperatives for marketers)
The US economy is heavily consumer dependent- that is
pretty much stating the obvious. What we seem to be oblivious to is how much
the consumer that drives the economy has changed since the Great Recession. We
do however feel the symptoms- the tried and tested remedies of the past
struggle to drive momentum. Profits stagnate- data from the Bureau of Economics indicate
corporate earnings have been in decline since 2012 after staging a recovery
following the recession.
Many marketers are opting to simply take price up
as demand stagnates without truly understanding the shift in consumer behavior
that is making past playbooks irrelevant. Below LinkedIn in post hones
in on 3 familiar yet often underestimated trends that are directly shaping the
interplay between consumer behavior and marketing strategy.
Subscribe to:
Posts (Atom)